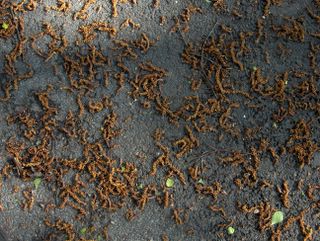
Yllä oleva 4 kuvan sarja on kuvattu samana iltapäivänä Espoon Tapiolassa. Kuvat on laitettu järjestykseen taiteellisten seikkojen mukaan. Ilmoitettu aikaskaala pitää kuitenkin paikkansa. Melko voimakas matalapaine oli tässä vaiheessa eteläisen Suomen yllä. Sen myötä länsituuli oli kuvauspäivänä voimakasta. Edellisenä yönä ja aamulla oli sadekuuroja, mutta iltapäivän aikana oli ajoittain vähän pilviä. Sen ansiosta näissä kuvissa nähdään runsaasti auringonvaloa. Voimakas tuuli aiheutti kukintansa päättävistä puista ja pensaista runsaasti laskeumaa, joista tässä lisää esimerkkejä. Tässä kuvassa rauduskoivun (Betula pendula) hedenorkkoja oli varissut runsaasti asfaltille ja voimakas tuuli oli jopa riipinyt muutaman tuoreen lehdenkin puista. Norkot eivät liikkuneet tuulen mukana pitkin ko. pintaa, koska päivän aikaisempien sateiden vuoksi ne olivat märkinä kuin liimautuneita alustaansa. Säätilanne: valitse Base Time 24.5.2006. Wetter3 A. Wetter3 B.
The 4 picture series above is captured during the same afternoon in the district of Tapiola in Espoo. The photos are placed in order according to artistic matters. However the mentioned time scale holds true. Rather strong low pressure was at this stage over Finland. Due to that westerly winds were strong during the day. During the last night and in the morning there were showers, but during the afternoon there were occasionally minor amount of clouds. Due to that we see in the pictures plenty of sunlight. The strong wind caused fallout from the trees and shrubs ending their blooming and here are some examples of that. In this picture male catkins of Silver Birch (Betula pendula) had been shed a lot on the asphalt and the strong wind had even stripped away a few fresh leaves from the trees. The catkins weren't moving across this surface with the wind, because due to the earlier rain of this day they were like glued onto the platform as they were wet. Weather condition: choose Base Time 24.5.2006. Wetter3 A. Wetter3 B.
Helsingin Puistolan säätilasto toukokuussa 2006 - Weather chart of Puistola, Helsinki in May 2006.
Flickr 1 Flickr 2
Tehoisa lämpösumma - The Effective Temperature Sum: 162,5


0 Comments:
Post a Comment
<< Home